Get in shape after 40 - and stay fit for life.
The theory and practice. No gym required.
Built on 14 years of lived experience.
Does this sound anything like you?
You get to a certain age. 40? 45? 50?
Life has taken over and your body has drifted into a pattern of decline.
You’re out of shape, carrying excess body fat and you’re unfit.
One day, you decide you’ve had enough. You want to change.
But what do you do next?
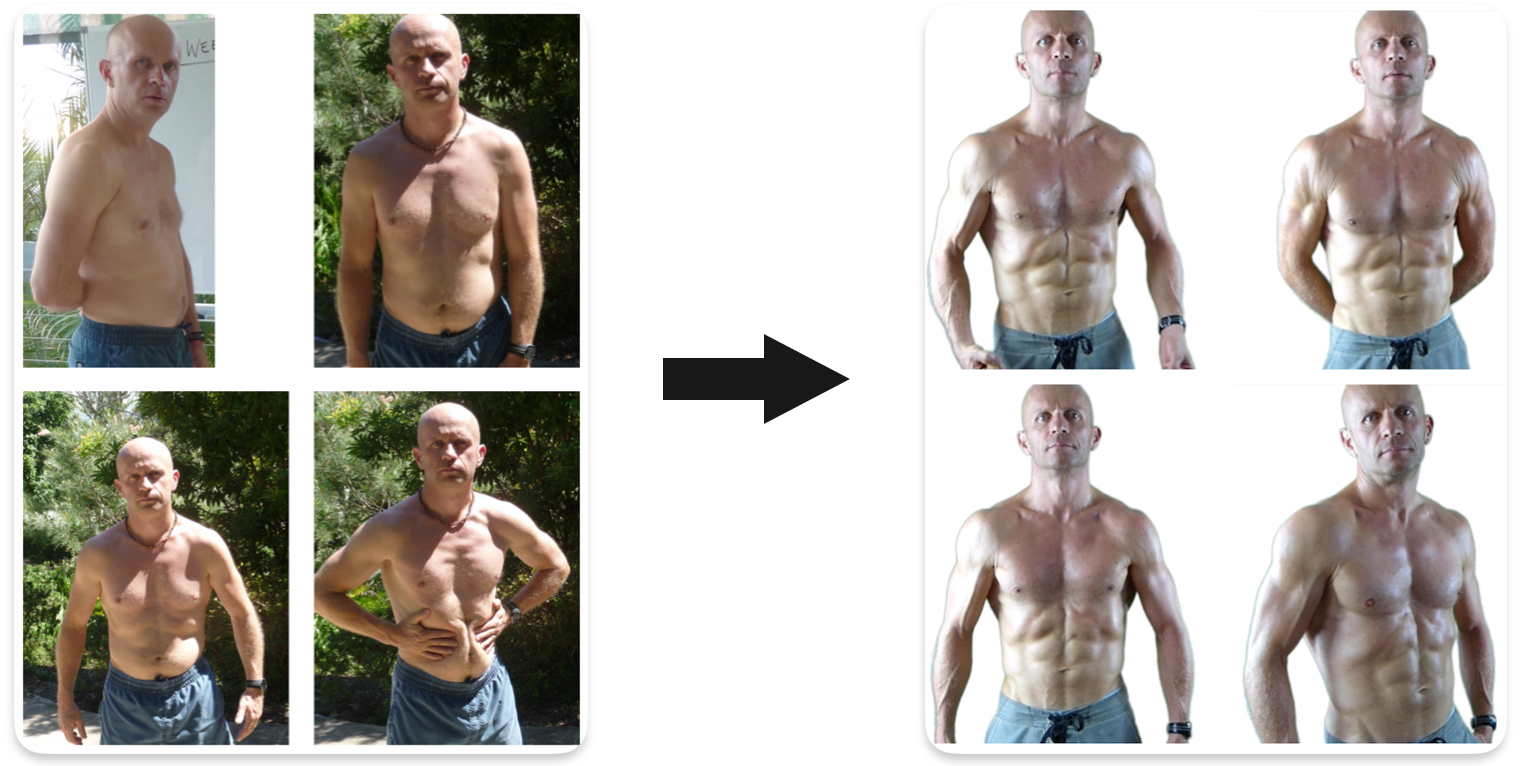
This was me at 46, back in 2012.
Here is exactly what I did next...
A fully documented transformation.
Everything planned, measured and recorded.
In 2012, at 46, I set some clear goals, built a science-based plan, and executed it over 150 days.
The results were pretty good.
21% → 9%
Body fat in 150 days
9.6 kg ↓
Fat lost.
A 60% reduction.
4.5 kg ↑
Muscle gained
A 8% increase.
Fitness↑
Strength
Endurance
14 years +
Result sustained and counting
Putting theory into practice to create and maintain
a lighter, leaner, fitter body.
Many people skip straight to doing — and wonder why it doesn't work. I wanted to put science to the test and guarantee my results. Here's a summary of the main steps.
🎯
Define the objectives
Get clear on exactly what you want. Your body composition and your fitness targets.
My body composition target was 10% body fat.
My fitness targets were to significantly improve cardiovascular endurance and muscular strength/endurance.
🧐
Learn how
Understand how-to create what you want.
How to get from A to B.
Be clear on the basics of fat-loss and muscle retention. Be clear on how to develop a fitter, stronger body etc.
🧭 A → B
Design a system that works for you
Plan how to get from A to B and your life will look, within a science based framework, that you can stick to.
A plan to move, train and rest.
A plan to supply energy and nutrition.
A plan to measure what you are doing.
⚡️🔥🚶🏻♂️🏃🏻♂️💪 😎 🛌
Active Living, Rest and Sleep
Walking 10k+ steps per day.
Jogs, runs and sprints in nature.
Home based bodyweight training.
Sleep and Rest.
⚡️⛽️ 🥩🍏 🫒 🍺 🚰
Supply Energy to Support the Goals
I didn't give-up anything.
Ate my regular diet.
Balanced protein, carbs and fats.
Controlled calories.
Minimised 'Sabotage'.
📏 📷 📈
Track Progress
Measured daily actions, walks, workouts, diet, calories etc.
Measured physical changes every 10 days.
Ensured that what I was doing was working.
What does "get in shape" actually mean?
Most people start with a vague intention — get fit, lose some weight, feel better. That's a direction, not a destination. For this to work, getting in shape needs to mean something specific.
Here it means four things working together:
Less total body weight — achieving a healthy weight for your height and frame
Less body fat, more lean muscle — changing what your weight is made of
Better cardiovascular endurance, strength and physical capability
Looking and feeling the way you want to — the subjective side that actually matters
The goal is to move from A — where you are now — to B — where you want to be. Everything else in this process is about closing that gap. The first job is to define both points clearly.
Three steps to defining your goal
1. Define A — take an honest measure of where you are right now. Weight, body fat if you know it, current fitness level.
2. Define B — set a specific target. A weight you want to reach, a body fat percentage, a fitness benchmark. Something concrete enough to aim at.
3. Quantify the gap — the difference between A and B tells you the size of the process ahead. In the next step (Theory) you'll learn how to translate that gap into a daily plan.
My A → B
In 2012 at 46, before changing anything about my diet or training, I sat down and got specific about what I wanted to create. Here's exactly what A and B looked like for me.
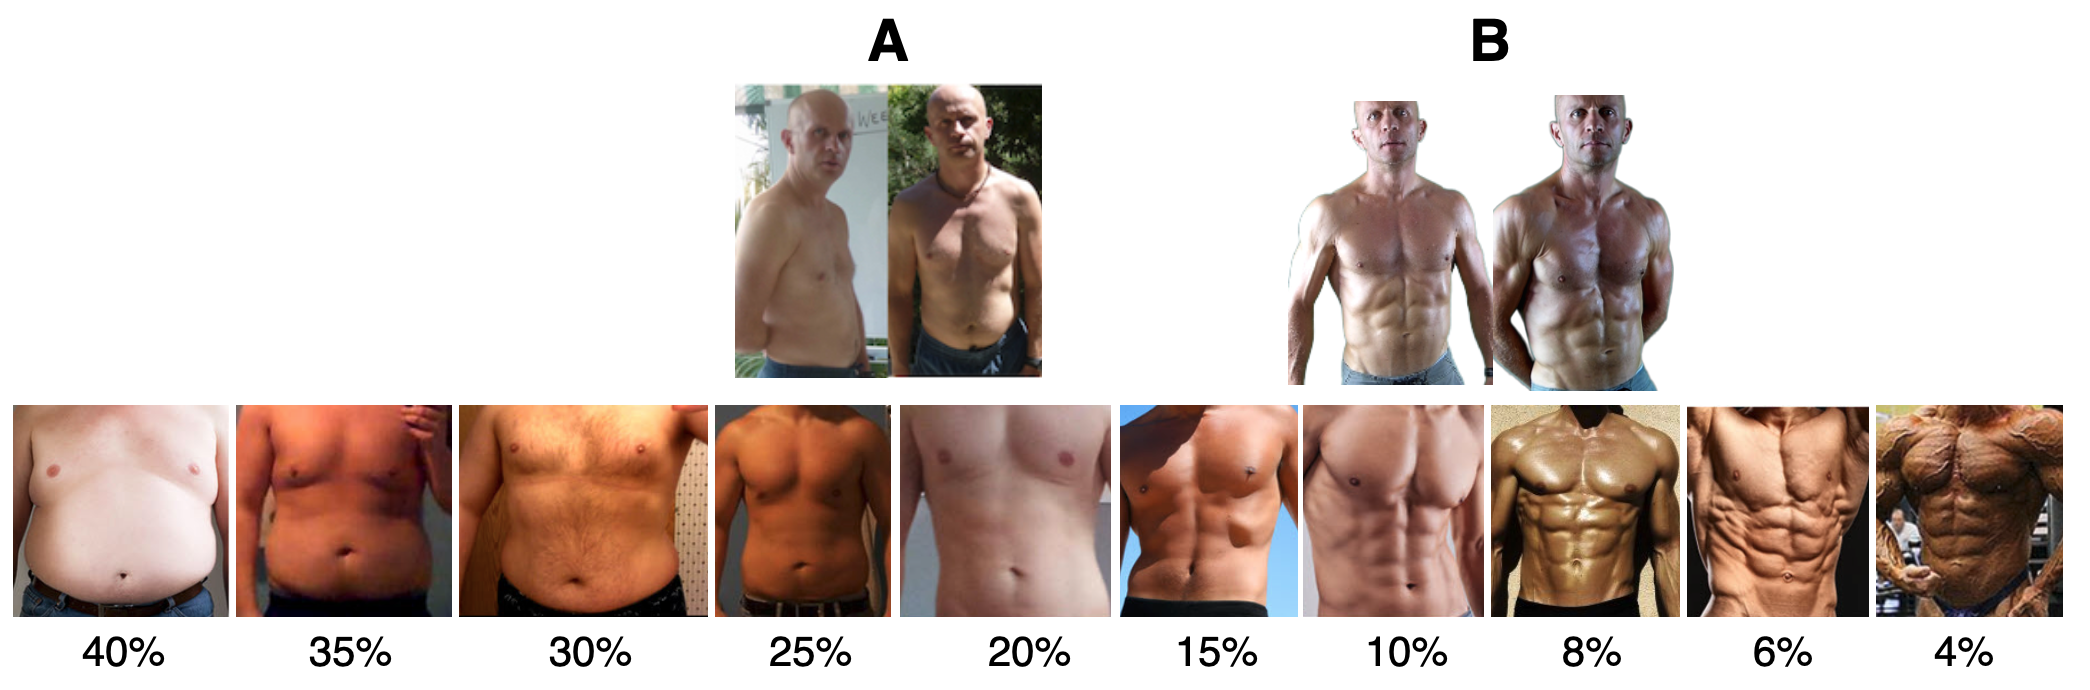
My A (21%) and B (9%) positioned on the body fat percentage spectrum. The journey took 150 days.
My primary body composition target was 10% body fat — a specific, measurable number I could track throughout the process. Everything else — training, diet, daily habits — was designed to get me there.
The gap between 21% and 10% is approximately 10 kg of fat. Once I knew that, I could calculate roughly how long it would take and what I'd need to do each day. That's what Step 2 — Theory — is about.
Setting your body goal
Your body goal defines the physical change you're aiming for. There are two ways to measure it — by weight, by body fat percentage, or both. Either is valid. What matters is that it's specific.
Body fat percentage is a more informative target than weight alone — because weight loss and fat loss are not the same thing. You can lose weight by losing muscle as well as fat, which is not the goal. The goal is to reduce fat while retaining or building lean muscle. That's body recomposition.
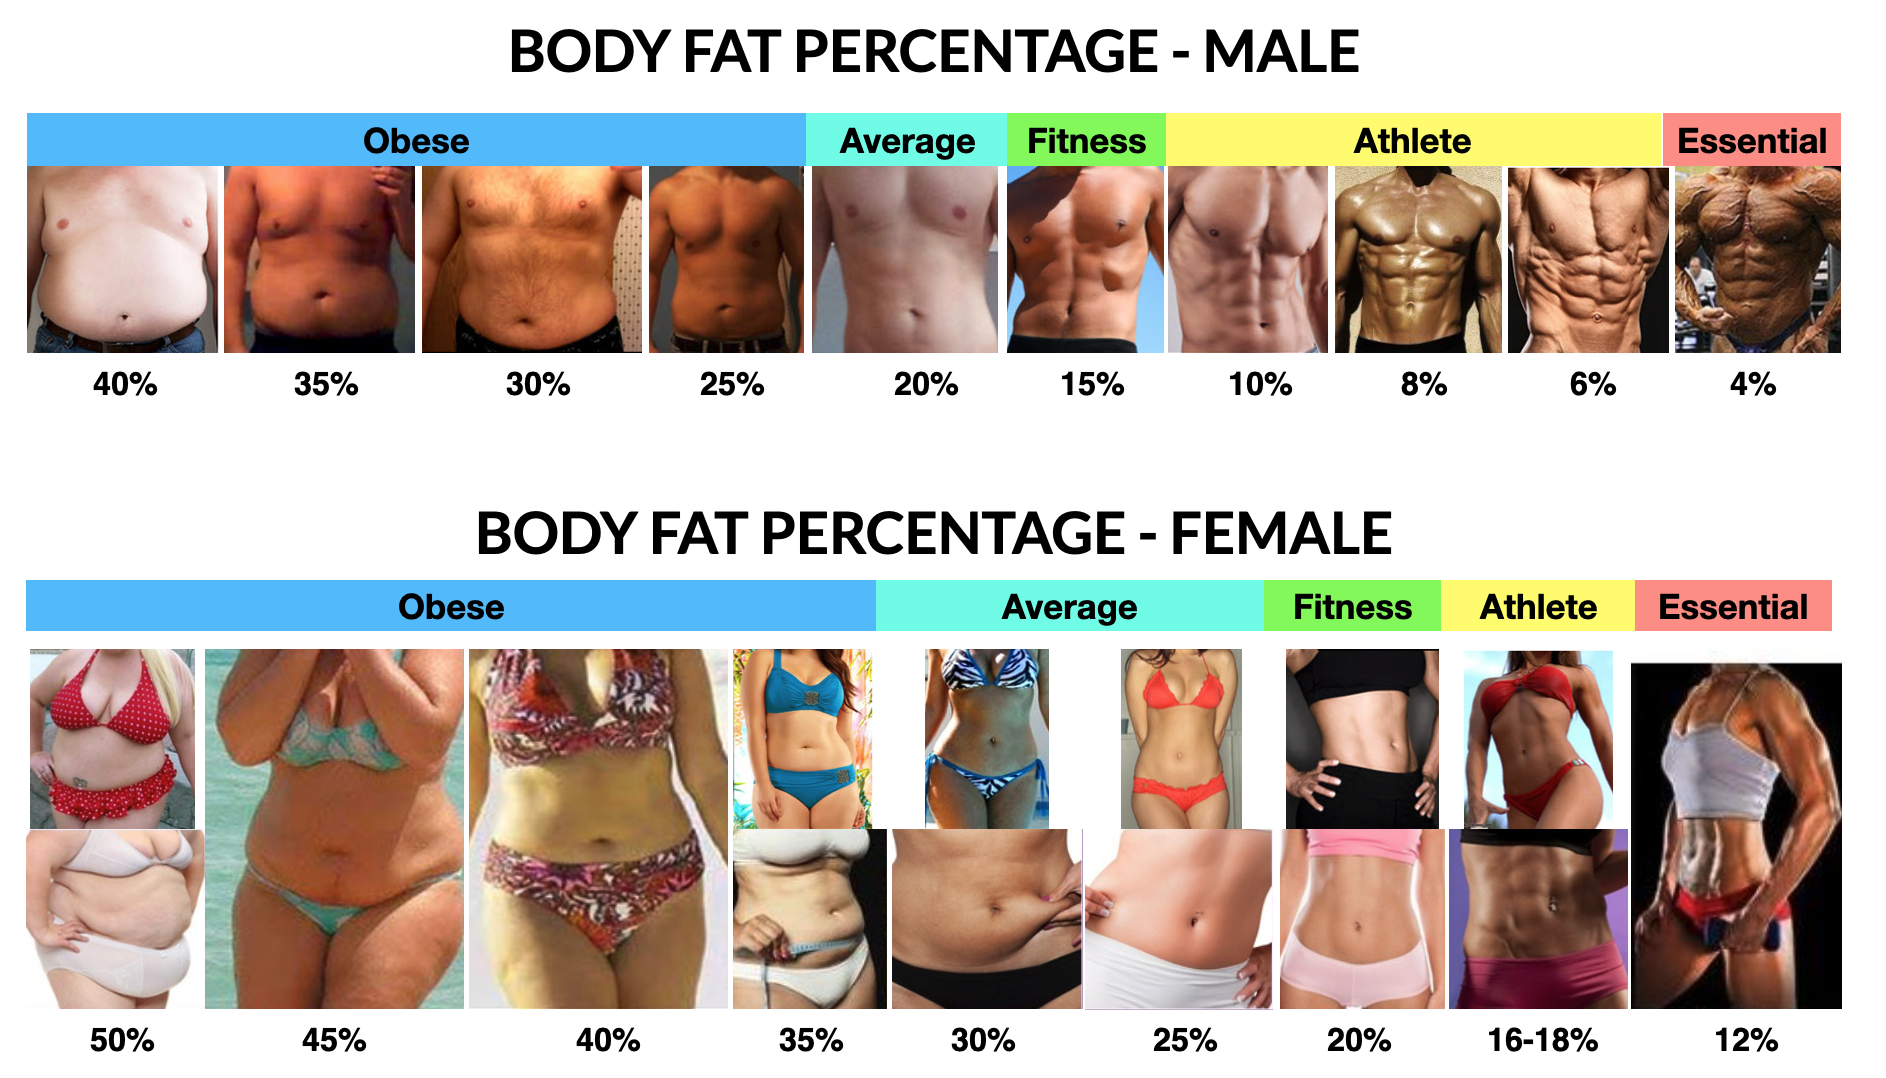
Body fat percentage visual reference — male and female. Use this to locate your approximate starting point and identify a realistic target.
A useful question: what body fat percentage were you at when you last felt good about how your body looked and performed? That's a reasonable B, regardless of what the scale said at the time.
Setting your fitness goal
Getting fitter isn't just about aesthetics or performance for its own sake. Fitness development during a caloric deficit preserves muscle, raises your daily calorie burn, and makes the whole process more effective. It's part of the mechanism, not a separate goal.
Your fitness goal doesn't need to be highly specific at this stage. What matters is the direction — a sense of what kind of fitter you want to become. More stamina? More strength? Both? The ABO40 approach develops both simultaneously, because cardio and resistance training serve different but complementary functions in the process.
Fitness and fat loss are not competing goals. Developing fitness raises your total daily energy expenditure — meaning you burn more calories every day. That makes creating a caloric deficit easier, which makes fat loss faster and more sustainable.
How you feel and look matters too — and it's worth writing down. "I want to feel comfortable taking my shirt off" or "I want to keep up with my kids" are valid fitness goals. They give the numbers a reason.
Now define yours
Before moving to Step 2, take a few minutes to write down your own A and B. It doesn't need to be perfect — it just needs to be specific enough to aim at. A goal that exists only in your head is a wish. A goal on paper is a commitment.
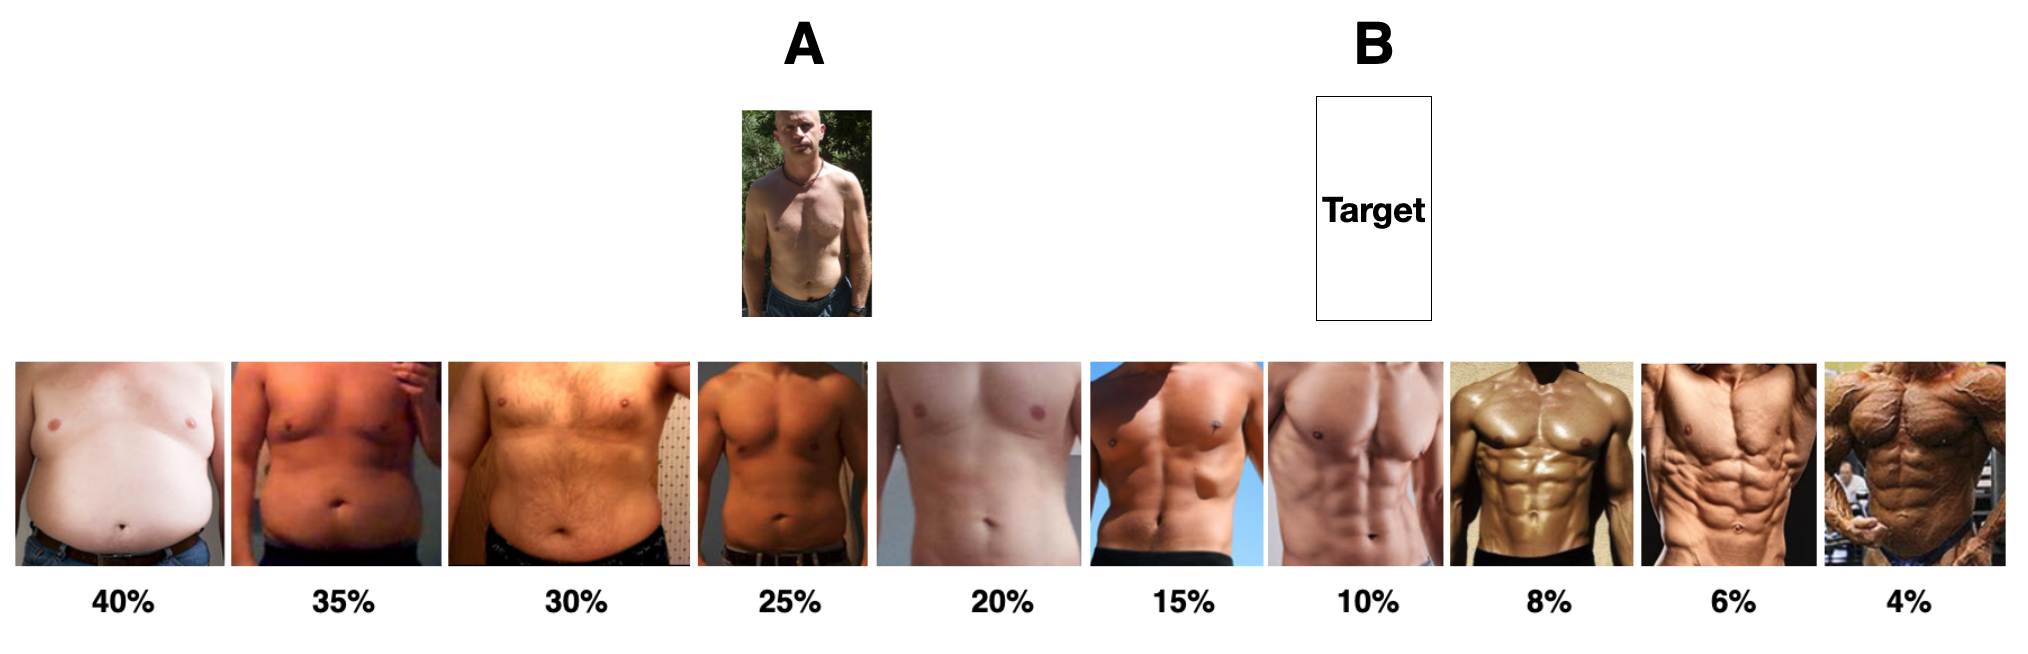
Where are you on the spectrum right now? Where do you want to be?
Once you have a B, the gap between A and B becomes the process. In Step 2 you'll learn how to calculate the size of that gap in calories and time — and what that means for your daily plan.
The gap between A and B is not a problem to be worried about. It's a process to be designed. That's exactly what the remaining steps are for.
Here's what happened
The graphs and charts below depict what happened over the course of 150 days.
If you want to see a free mini-course, video summary, of me talking through this - click hereActivity, Training and Energy Output
⚡️🔥🚶🏻♂️🏃🏻♂️💪 😎 🛌
The tabs below give summaries of my activity - things that burn calories
This is a summary of STEP 4 - ACTION above.
Click on the 'v' to reveal.
Avg daily TDEE
2,756 kcal
total energy burned
BMR
1,600 kcal
58% of TDEE
NEAT
800 kcal
29% of TDEE
Exercise (EAT)
356 kcal
13% of TDEE
Structured exercise — running, resistance training, sprints — accounted for just 13% of total daily energy expenditure. The other 87% came from simply being alive (BMR) and moving through daily life (NEAT). This is an important recognition: you don't necessarily need to just train hard to burn calories. You can burn more by being consistently active in ways that are less intense and sustainable e.g. walk more.
The calories your body burns at complete rest — to keep your heart beating, lungs breathing, and organs functioning. You burn this doing absolutely nothing. It cannot be directly changed in the short term, but building lean muscle over time raises it.
The calories burned through all daily movement that isn't structured exercise — walking, standing, climbing stairs, fidgeting. At 90+ minutes of walking per day, NEAT contributed nearly twice as many calories as all structured training sessions combined. This is the most controllable and underestimated component of TDEE.
Calories burned during structured exercise sessions — cardio, resistance training and sprints. Important for fitness development and muscle retention, but the smallest of the three components. 119 active training days over 150 averaged just 356 kcal per day across the full period.
How TDEE built up across the 150 days — BMR constant, NEAT consistent, EAT increasing with fitness
Active days
119
of 150 total
Rest days
31
planned recovery
Total exercise
84.8 hrs
~34 min/day avg
Total EAT
53,439 kcal
burned via exercise
119 out of 150 days included structured exercise — but the average session was just 34 minutes. This wasn't extreme training. It was a consistent, moderate habit that contributed to TDEE and supported muscle retention. No gym membership required — all cardio was done outdoors, all resistance training at home.
Cardio sessions
98
avg 37 min · 4.6/wk
Resistance sessions
57
avg 26 min · 2.7/wk
Total cardio
59.8 hrs
3,590 minutes
Total resistance
24.9 hrs
1,495 minutes
Cardio — running, jogging and sprinting outdoors — was the primary tool for raising exercise calories. Resistance training was done at home, 2–3 times per week, focused on retaining and building muscle during the deficit. Both increased progressively as fitness improved across the 150 days.
Every day of the 150-day transformation mapped by activity type. Each cell is one day. The rhythm of consistent activity — with rest days built in — is the pattern that made the results possible. Hover over any cell for the day and session detail.
Days 1–75
Days 76–150
NEAT vs EAT
2.2×
NEAT burned more
Avg daily exercise
34 min
43 min on active days
Peak 10-day block
Days 71–80
2,880 kcal avg TDEE
Longest deficit streak
19 days
Days 78–96
NEAT burned more than exercise — by a factor of 2.2
Daily walking at 90+ minutes contributed an average of 800 kcal per day. All structured exercise sessions combined averaged 356 kcal per day. NEAT was the larger lever. This is why the ABO40 approach emphasises daily movement and walking as a foundation — not gym sessions.
BMR is your biggest ally — and you already have it
At 1,600 kcal per day, BMR accounted for 58% of total energy expenditure — burned simply by being alive. You don't earn this through effort; it's always running. The practical implication: you need a smaller exercise contribution than most people assume to create a meaningful caloric deficit.
Just 34 minutes of exercise a day on average
Across all 150 days — including rest days — average exercise time was 34 minutes. On active days it was 43 minutes. These are not the numbers of someone training obsessively. They are the numbers of someone who showed up consistently with modest, sustainable effort and let NEAT and BMR do the heavy lifting.
Rest days were part of the plan
31 rest days — roughly one every five days — were built in deliberately. On rest days, BMR and NEAT continued; only EAT dropped to zero. A rest day still burned approximately 2,400 kcal. Recovery is not a setback — it is when the body adapts to the training stimulus.
Resistance training protected muscle
57 resistance sessions averaging 26 minutes each — done at home with bodyweight and free weights — were enough to not only retain lean muscle during the deficit but to gain 4.7 kg of it. Frequency and consistency mattered more than session length or equipment.
No gym. No specialist equipment.
Every cardio session was done outdoors. Every resistance session was done at home. The entire activity programme was built around what was accessible and sustainable in real daily life — not what looked impressive on a plan. The barrier to each session was deliberately kept as low as possible.
Diet, Macros, Energy Supply
⚡️⛽️ 🥩🍏 🫒 🍺 🚰
The tabs below give summaries of my diet, food, drink - things that supply calories
This is a summary of STEP 5 - DIET above.
Click on the 'v' to reveal.
Avg protein
143 g
572 kcal · 26%
Avg fat
68 g
612 kcal · 28%
Avg carbs
214 g
857 kcal · 39%
Avg alcohol
23 g
160 kcal · 7%
Every gram of protein, fat and carbohydrate tracked daily for 150 days. Days 19 and 20 are shown as gaps — data was not recorded on those days. The consistency of intake across 150 days, with no extended periods of severe restriction, is one of the reasons the process was sustainable.
Protein trend
↑ rising
111g → 141g (peak)
Carbs trend
↓ falling
281g → 181g
Fat trend
→ steady
61g avg, slight rise
Across 15 ten-day blocks a clear pattern emerges: carbohydrate intake gradually declined while protein rose. This wasn't a deliberate low-carb strategy — it reflects natural dietary adaptation as the process progressed and awareness of food choices increased.
The overall macro split across 150 days — including alcohol as a calorie source. Protein at 26% of total intake supported muscle retention throughout the deficit. No macros were eliminated; portions were controlled.
| Source | % | Grams | kcal |
|---|---|---|---|
| Carbs | 39% | 214 g | 857 |
| Fat | 28% | 68 g | 612 |
| Protein | 26% | 143 g | 571 |
| Alcohol | 7% | 23 g | 160 |
| Total | 100% | — | 2,200 |
Excluding alcohol: carbs 42% · fat 30% · protein 28% · 2,040 kcal
Every food consumed across 150 days categorised by food group, expressed as a percentage of average daily energy intake. Vegetables at 23% — the largest single category — reflects a diet built around whole foods and high volume, low-calorie eating.
Max protein day
229 g
Day 59
Min protein day
56 g
lowest recorded
Max carbs day
331 g
1,324 kcal
Max fat day
121 g
1,089 kcal
I didn't change what I ate — I changed how much
The food groups tell the story clearly: vegetables, potatoes, dairy, chicken, red meat, fruit. These are ordinary foods from any normal kitchen. No specialist diet foods, no elimination of food groups, no meal replacement shakes. Portion control and calorie awareness were the only tools.
Protein was the most important macro
At an average of 143g per day — 26% of total calories — protein was high enough to protect lean muscle during the caloric deficit. This is what made body recomposition possible. Without sufficient protein, the weight loss would have included significant muscle loss alongside the fat.
Alcohol was tracked, not eliminated
At 7% of average daily calories, alcohol was a consistent part of the diet — accounted for, measured, and included in the daily total. This is one of the most important practical lessons: you don't have to give up the things you enjoy. You need to know what they cost and plan accordingly.
Carbs fell naturally over time
Average carb intake dropped from 281g in the first 10 days to 181g by the final block — a 36% reduction. This wasn't a planned low-carb diet. It was the natural result of learning which foods were calorie-dense and gradually making more informed choices without restriction.
Vegetables were the foundation
At 23% of total energy intake, vegetables were the single largest food group. High in volume, low in calories, high in fibre — they enabled larger meals without exceeding the daily calorie target. Building meals around vegetables first is one of the simplest and most effective strategies in the whole approach.
Six diet principles that made it work
Eat favourite meals but learn their energy values. Cut back on processed high-calorie food. Minimise second helpings. Stop eating when full. Focus on the goal when making food choices. Simple rules, applied consistently — not a complex diet protocol.
Energy Balance.
Activity and Energy Output v Diet and Energy Supply
⚡️⚖️
The tabs below give summaries of the balance/imbalance between energy expended and energy consumed.
It determines what happens to my body weight and composition etc.
This is a summary of the effects of STEPS 4 and 5 above.
Click on the 'v' to reveal.
Avg calories burned
2,756
per day (TDEE)
Avg calories consumed
2,202
per day
Total burned
413,439
over 150 days
Total consumed
330,369
over 150 days
Every day for 150 days I measured both sides of the energy equation — calories burned through activity and calories consumed through food and drink. The gap between the two lines is the deficit that drove the fat loss. I didn't follow a restrictive diet — I simply kept consumption consistently below expenditure.
Avg daily deficit
554 kcal
per day
Total deficit
83,070 kcal
over 150 days
Deficit days
134
of 150
Surplus days
15
of 150
134 of 150 days were in a caloric deficit. The 15 surplus days — where I consumed more than I burned — show that perfection isn't the goal. Consistency is. A single surplus day doesn't derail progress; it's the overall pattern across weeks and months that determines the result.
Predicted fat loss
10.78 kg
from energy balance
Measured fat loss
9.6 kg
skinfold measured
Correlation
89%
theory vs reality
The blue line shows cumulative theoretical fat loss calculated day-by-day from the energy deficit. The green markers show fat loss actually measured every 10 days via skinfold callipers. The two lines track each other closely throughout — a strong real-world validation that the science of energy balance works exactly as predicted.
Avg daily deficit
554 kcal
median 628 kcal
Max single-day deficit
1,584 kcal
Day 71
Max single-day surplus
1,250 kcal
Day 111
Max TDEE
3,600 kcal
Day 59
Min consumption
1,453 kcal
Day 106
Longest deficit streak
19 days
Days 78–96
The target deficit held perfectly
The textbook target for steady fat loss is ~500 kcal/day. My average came in at 554 — almost exactly on target. More telling: the three 50-day blocks averaged −565, −564 and −532 kcal respectively. The consistency didn't drift or fade from start to finish.
94 of 150 days exceeded 500 kcal deficit
40 further days were in deficit but under 500 kcal. Only 15 days were in surplus — meaning 90% of all days were calorie-negative. The standard deviation of 460 kcal reflects natural daily variation while the average held steady throughout.
The biggest surplus day didn't matter
Day 111 was both the highest surplus (+1,250 kcal) and the highest consumption day (3,650 kcal) of the entire 150 days. A notable outlier — but one day in 150 had zero measurable impact on the overall result. Consistency over time, not perfection every day.
No severe restriction, ever
Only one day in 150 dipped below 1,500 kcal consumed. There was no crash dieting, no severe restriction, no hunger-driven failure points. Sustainable eating — controlled portions of normal food — was enough to produce a 554 kcal average daily deficit.
Activity drove the deficit, not starvation
The gap between TDEE (2,756 avg) and intake (2,202 avg) came primarily from raising activity levels, not from drastically cutting food. The max TDEE of 3,600 kcal on Day 59 shows how much a high-activity day moves the numbers — without touching the diet at all.
19 consecutive deficit days
The longest unbroken deficit streak ran from Day 78 to Day 96 — nearly three weeks without a single surplus day. This wasn't white-knuckle willpower; it was the result of established habits and a lifestyle that made the deficit the default, not the exception.
Results Part 1 - Fitness Improvements
📏 📷 📈
The tabs below give summaries of some fitness of my measured fitness improvements.
STEP 6 - MEASURE, above
Click on the 'v' to reveal.
10k Day 1
~60 min
approx baseline
10k Day 150
44m 50s
timed in an event
10k improvement
−15m 10s
25% faster
Est. 5k Day 150
~21m 30s
from ~28m 46s
Running was the primary cardiovascular training method — outdoors, no treadmill. The 10k time at Day 150 was recorded in an actual event, making it a genuine measured result rather than an estimate. The 25% improvement in pace over 150 days reflects both improved cardiovascular fitness and reduced body weight.
Pull-ups
+136%
6–8 → 15–18 reps
Push-ups
+203%
18–20 → 55–60 reps
1-arm push-ups
New
0 → 10–12 reps
Leg raises
+300%
4–6 → 18–22 reps
All strength figures are single-set maximums measured at Day 1 and Day 150. The gains reflect both increased strength and reduced bodyweight — fewer kilograms to move means more reps possible. The 1-arm push-up is a good example: it wasn't just strength that improved, but the combination of strength and body composition together.
These are my current figures — in my 60s, 13 years after the transformation. The goal was never to peak at Day 150 and decline. It was to build a sustainable active lifestyle that compounds over time. These numbers are the result of that.
Daily steps
15–20k
every day
5k time
~28 min
same as Day 1 in 2012
10k time
~60 min
maintained
Pull-ups
15–18
held at Day 150 level
Push-ups
55–60
held at Day 150 level
Resting HR
50 bpm
athletic range
VO2 Max
47.9
above average for age
HRV
33 ms
good recovery marker
The 5k time today is almost exactly the same as the estimated Day 1 baseline from 2012 — but that was at age 46. Running the same pace in your 60s, after 13 years, is not maintenance. It's a significant achievement in itself.
Fitness and fat loss worked together
Cardiovascular training raised TDEE and drove the caloric deficit. Resistance training preserved and built muscle. The two goals reinforced each other — getting fitter made fat loss easier, and losing fat made getting fitter easier. They were never separate programmes.
25% faster over 10k in 150 days
Going from approximately 60 minutes to 44m 50s for 10k represents a 25% improvement in pace — achieved through consistent outdoor running, no specialist coaching, and no track sessions. The Day 150 result was set in an actual event, making it a verified measured time.
Bodyweight training produced remarkable strength gains
Push-ups tripled. Pull-ups more than doubled. A new skill — 1-arm push-ups — appeared from a zero baseline. These were achieved with home equipment only, 2–3 sessions per week, averaging 26 minutes per session. The gains reflect improved neuromuscular efficiency as much as raw strength.
The fitness held — 13 years later
Pull-up and push-up numbers are identical to Day 150. Running times are maintained. Resting heart rate of 50 bpm and VO2 Max of 47.9 are both in athletic range for someone in their 60s. This is what a sustainable approach looks like — not a 150-day peak followed by decline, but a new baseline that holds.
Running the same pace at 60 as at 46 — in context
The current 5k of ~28 minutes matches the estimated Day 1 baseline from 2012. That might sound like no improvement — but VO2 Max naturally declines with age. Maintaining the same performance over 13 years represents real effort against that decline. The body aged; the fitness didn't.
What this means for you
The fitness improvements in the 150 days were not the result of a specialist programme or exceptional genetics. They were the result of consistent, moderate activity — running outdoors and training at home — applied over time. The same approach is available to anyone willing to show up regularly.
Results Part 2 - Body Changes
📏 📷 📈
The tabs below give summaries of key body metrics.
STEP 6 - MEASURE, above
Click on the 'v' to reveal.
Start
72.9 kg
Day 1
End
68.0 kg
Day 150
Lost
−4.9 kg
6.7% reduction
BMI
23.3
from 24.9
My total weight dropped 4.9 kg over 150 days — but weight alone doesn't tell the full story. The fat and lean mass charts show what was actually happening underneath.
Fat lost
−9.6 kg
15.7 → 6.1 kg · −61%
Lean gained
+4.7 kg
57.2 → 62.0 kg · +8%
This is the chart that matters most. While I was losing 9.6 kg of fat, I was simultaneously gaining 4.7 kg of lean muscle — a process known as body recomposition. Getting both moving in the right direction at the same time requires the right caloric deficit, enough protein, and consistent resistance training.
Start
21.5%
Day 1
End
8.9%
Day 150
Reduction
−12.6%
58.6% drop
My body fat dropped from 21.5% to 8.9% in 150 days — from average to well into athletic range. This was my primary target from day one, because it measures the ratio of fat to muscle rather than just total weight.
Waist lost
−13.5 cm
90 → 76.5 cm
Hip change
−1.5 cm
98 → 96.5 cm
WHR
0.79
from 0.92
My waist shrank by 13.5 cm while my hips barely changed — exactly the right pattern. Waist reduction reflects the loss of visceral abdominal fat, which is the most health-relevant fat to lose and the clearest visible sign of the transformation.
Total skinfold
−23.5 mm
39 → 15.5 mm · −60%
The suprailliac site — just above the hip — drove most of the total reduction, which is typical for male abdominal fat storage. The total 4-site measurement dropped by 60%, providing an independent confirmation of what the body fat percentage figures were showing.
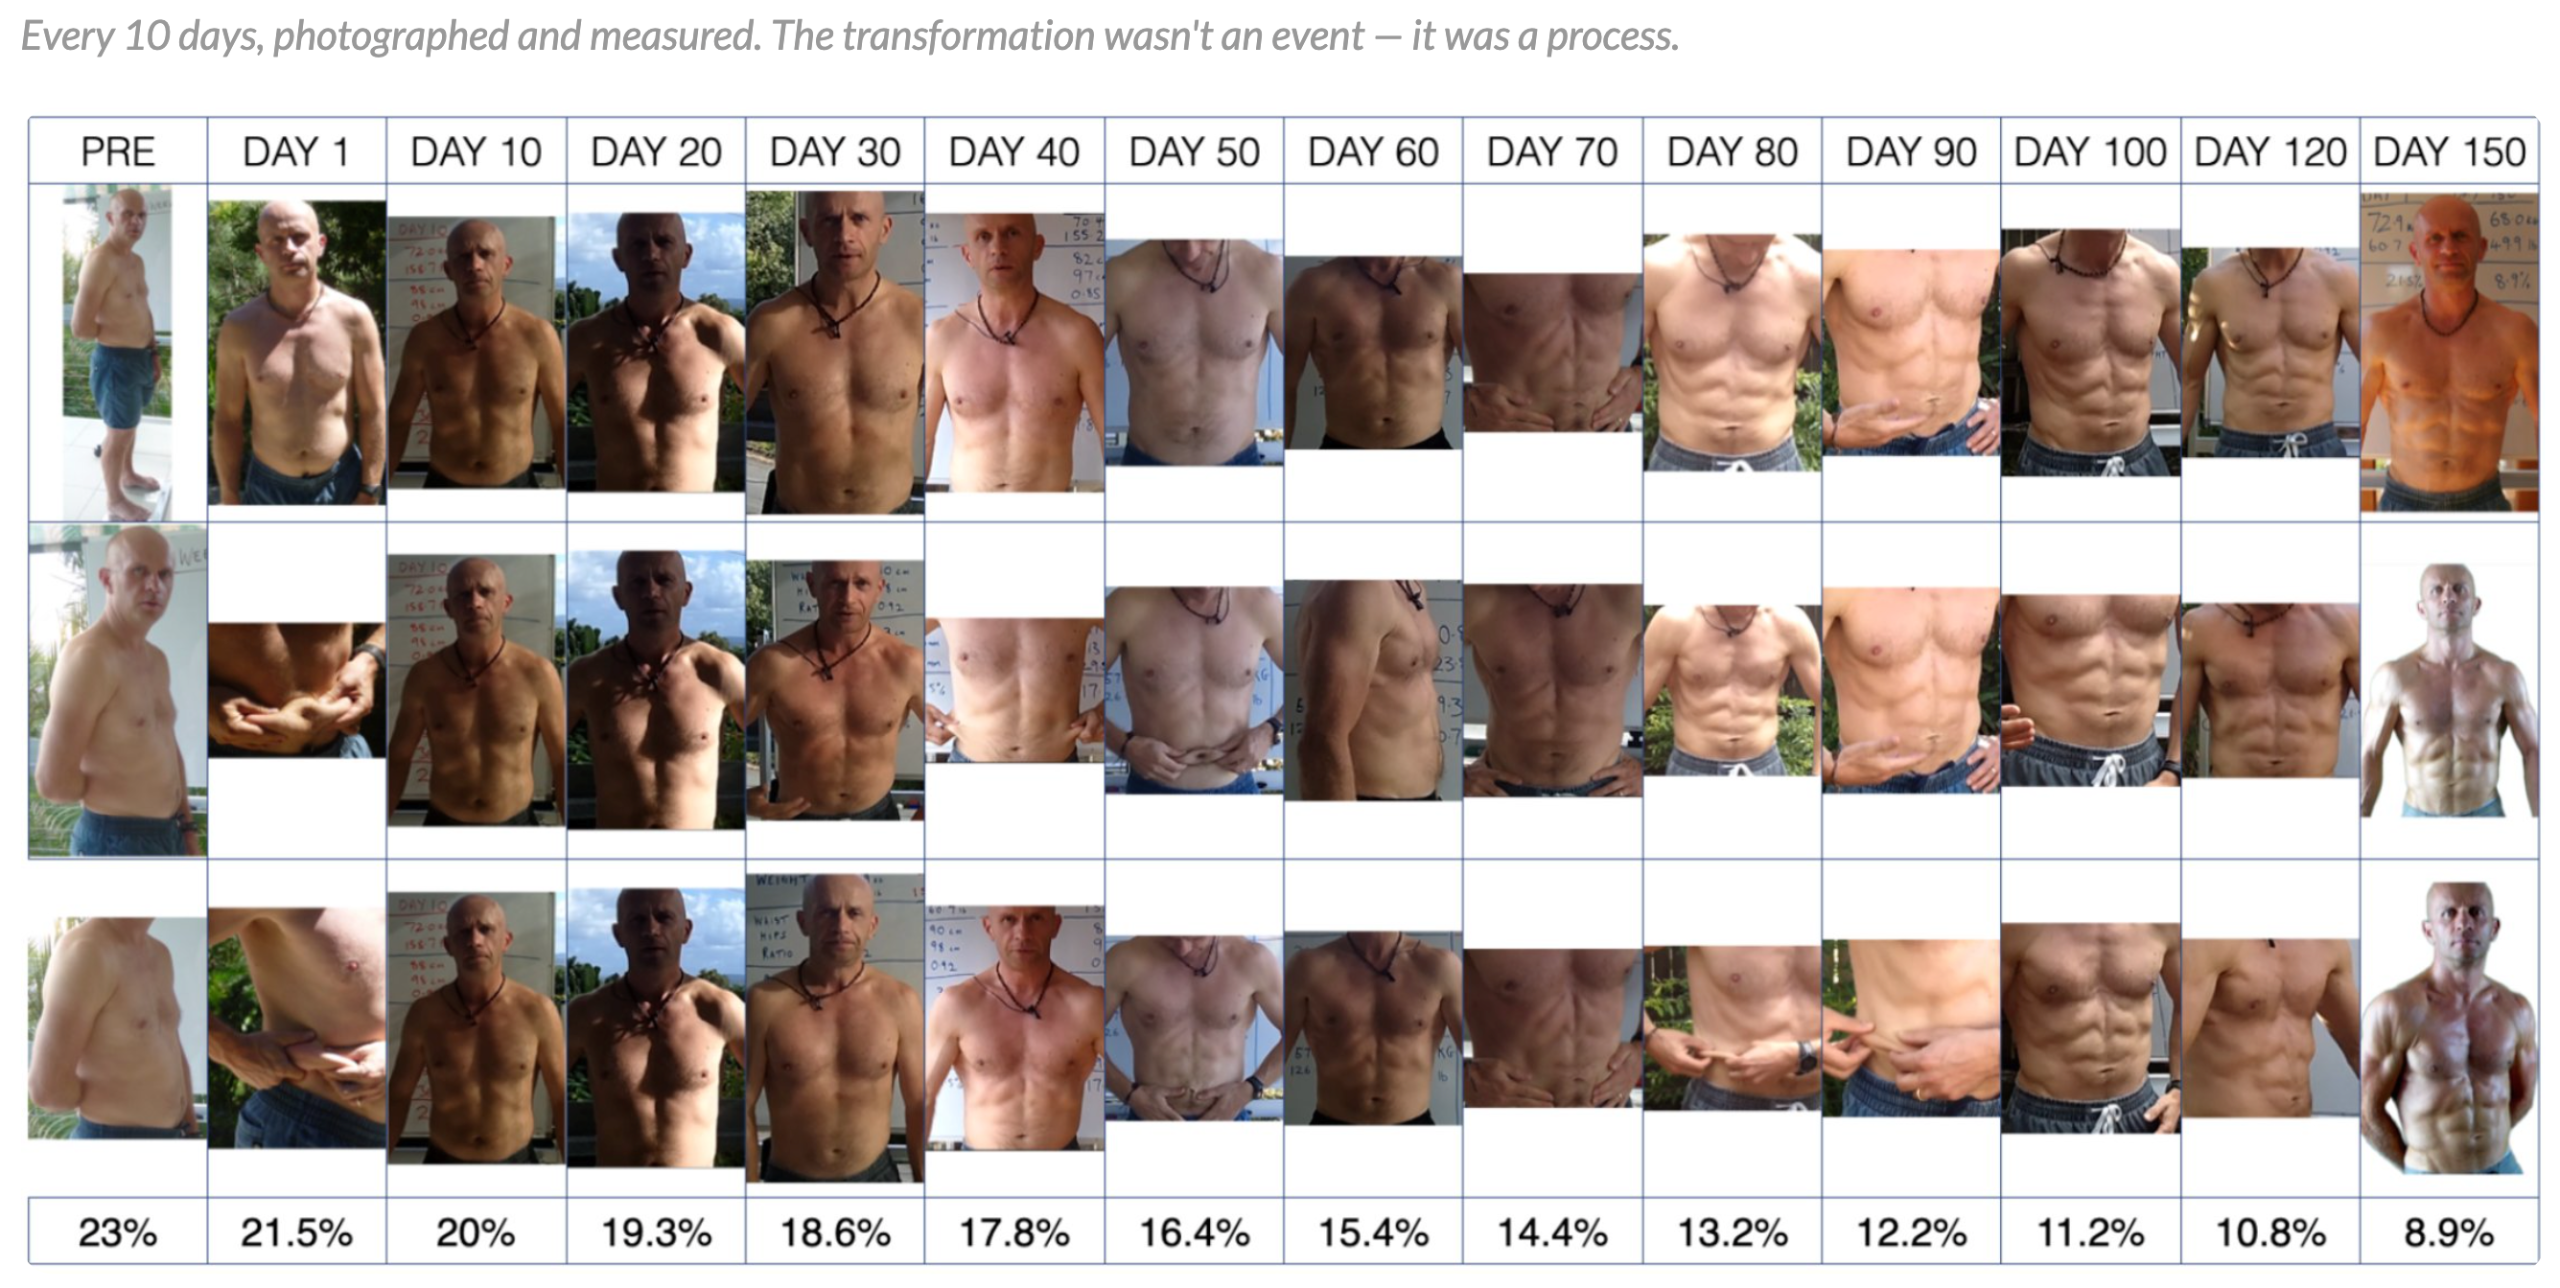
Every 10 days, photographed alongside the data. The numbers confirm what the photos show — 150 days of consistent daily behaviours, no gym required.
Start here — Clive's story, free.
A short video walkthrough of the 2012 transformation — what Clive did and why it worked, and what it means for you.

Certified trainer. Geophysicist. Living proof.
Clive Burns is a certified personal trainer (YMCA London), Precision Nutrition Coach, Primal Health Coach, and former marine geophysical surveyor with a degree in Geology. In 2012 at 46 he documented his own body transformation with the same data-driven rigour he'd spent years applying to survey work — measuring everything, testing the science, recording every result.
Now in his 60s, he sustains the result daily: 15–20k steps, 5k runs, 150 press-ups, 150 squats, 40 pull-ups. This site exists to share the experiences and systems with anyone in a similar situation to where he was in 2012.
